Thinking about solar energy? The average cost of installing a home solar system in 2025 is $29,360 before federal tax credits. The federal solar tax credit can cut this to around $20,552, making the home solar cost more affordable. Over two decades, prices have dropped nearly $15,000, but understanding the full financial picture is key. While the average cost of solar panels for home setups varies, savings over 25 years can reach $48,000. However, factors like maintenance, warranties, and state incentives also shape the final price.
From upfront expenses to long-term benefits, this guide breaks down every dollar. Federal incentives slash costs, but regional differences matter. For instance, Arizona’s systems average $18,799 post-tax credits, while Massachusetts sees $23,107. Solar’s return depends on local electricity rates and incentives. With prices rising 6.2% since 2022, now could be the right time to act.
Key Takeaways
- Average system cost: $29,360 before tax credits
- Federal tax credit reduces costs by up to $8,808
- 25-year savings can reach $48,000
- Payback periods range from 3.7 to 19.1 years
- State incentives and electricity price hikes impact savings
Understanding Home Solar Cost: The Complete Picture
Unraveling the residential solar panel installation cost requires looking at every piece of the puzzle. From hardware to labor, each part adds up to your total investment.
What Makes Up Your Solar Investment
Every dollar spent on solar serves a purpose. Here’s the math:
- Solar panels (12%): $0.36 per watt
- Inverters (11%: $0.33 per watt)
- Racking (8.5%: $0.26 per watt)
- Permits and inspections (3%: $0.09 per watt)
National Average Costs for Residential Systems
The average residential solar panel installation cost sits around $21,816 pre-incentives. After the 30% federal tax credit, that drops to roughly $15,271. A 5-kW system, for instance, costs $16,800 upfront but lowers to $11,760 post-credits. Smaller systems like 4 kW can start at $14,560 before incentives.
Cost Variations by State and Region
Geography plays a big role. In California, systems average $14,476 post-incentives, while West Virginia hits $31,636. Why the gap? Labor rates, local regulations, and state incentives shift totals. States programs in New Jersey or Washington D.C. often push numbers lower. These differences highlight why researching local options is key to finding affordable solar panel installation.
Key Factors That Influence Your Solar Panel Pricing
Choosing the right solar system requires understanding what shapes your home solar cost. Five main elements stand out:
- Panel choice: Efficiency levels and brand reputation directly impact pricing. Monocrystalline panels, for instance, cost more upfront but generate more power per square foot.
- System size: Larger setups reduce cost per watt due to economies of scale, though they may face higher permitting fees.
- Hardware add-ons: Batteries or inverters add to expenses but boost energy independence.
- Purchasing method: Leasing or financing options affect long-term affordability compared to upfront cash payments.
- Installer selection: Competing quotes can reveal pricing gaps of up to 30% for identical systems.
| Panel Type | Efficiency | Average Cost/Watt |
|---|---|---|
| Monocrystalline | 15-22% | $0.25–$0.40 |
| Polycrystalline | 13-16% | $0.20–$0.30 |
| Thin Film | 10-13% | $0.15–$0.25 |
Geographic factors also play a role: regions with abundant sunlight need fewer panels, lowering total home solar cost. Roof age and orientation affect installation complexity—southern-facing roofs reduce mounting costs. Use a solar panels cost estimator tool to see how these variables interplay. Shopping around for installers and considering bulk discounts can uncover savings opportunities without sacrificing quality.
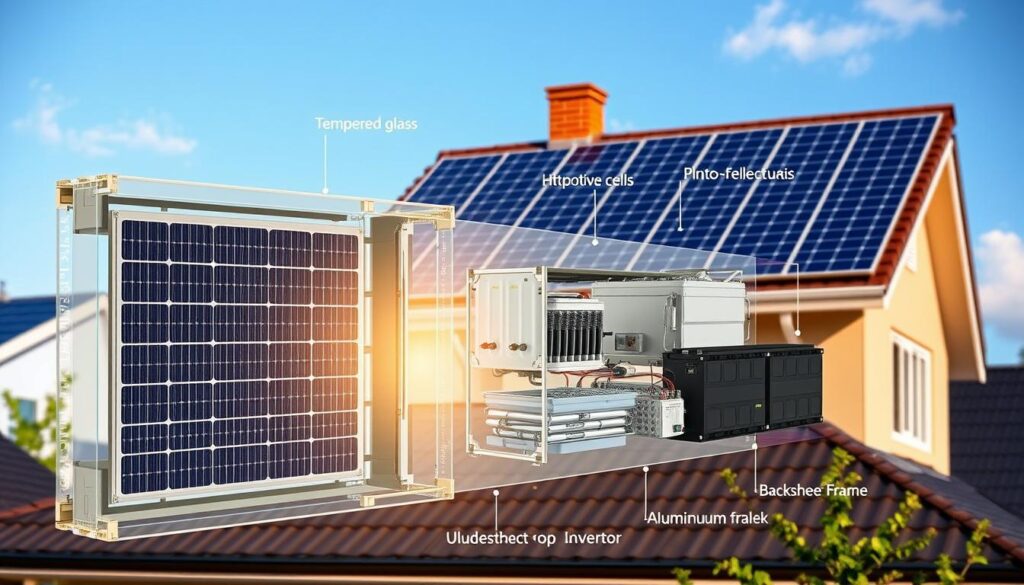
Breaking Down Solar Panel System Components
Selecting the right components shapes both your budget and energy output. The average cost of solar panels for home systems starts with panel quality, inverters, and installation hardware.

Panel Quality and Efficiency Differences
| Type | Efficiency | Cost/Watt | Lifespan |
|---|---|---|---|
| Monocrystalline | 15-22% | $0.30–$0.50 | 25+ years |
| Polycrystalline | 13-17% | $0.25 | 20-25 years |
| Thin-Film | 10-13% | Lowest | 10-15 years |
Monocrystalline panels offer top efficiency but cost more upfront. Polycrystalline is budget-friendly but takes more roof space. Thin-film is best for small spaces but degrades faster.
Inverter Options and Their Price Points
- String inverters: $1,000–$2,000 (ideal for uniform roofs)
- Micro-inverters: $0.30–$0.50 per watt (suited for shaded roofs)
- Power optimizers: Mid-range cost, blends string/micro benefits
Inverters last 10–15 years and affect energy conversion efficiency.
Mounting Hardware and Additional Equipment Costs
Mounting racks and wiring add 10–15% to the residential solar panel installation cost. Adding a Tesla Powerwall 3 battery with installation can cost over $16,500 pre-incentives. Monitoring systems add $200–$500. Rooftop angles and shading may require custom hardware, raising costs further.
Installation Expenses: What to Expect from Professionals
Installation accounts for 10–20% of your home solar cost. Choosing affordable solar panel installation experts ensures your system operates safely and efficiently. Let’s break down what goes into these critical expenses.
Labor Costs Explained
- Rooftop complexity: Flat roofs cost less than uneven or angled designs.
- Regional rates: Labor prices vary by location—urban areas often charge 15–25% more than rural zones.
- Soft costs (permits, design, etc.) make up 64% of total system costs, per industry data.
Permit and Inspection Fees
Expect $1,000–$3,000 for permits and inspections. These cover:
- Building permits
- Electrical safety checks
- Utility interconnection approvals
Some regions offer technical assistance programs cutting permit costs by 20%.
Comparing DIY vs. Professional
DIY setups may save upfront labor costs but risk:
- Voided warranties (most exclude non-professional work)
- Hidden fees for code violations
- Increased insurance premiums
Professionals ensure compliance and long-term performance, often justifying their fees through warranty coverage and expertise.
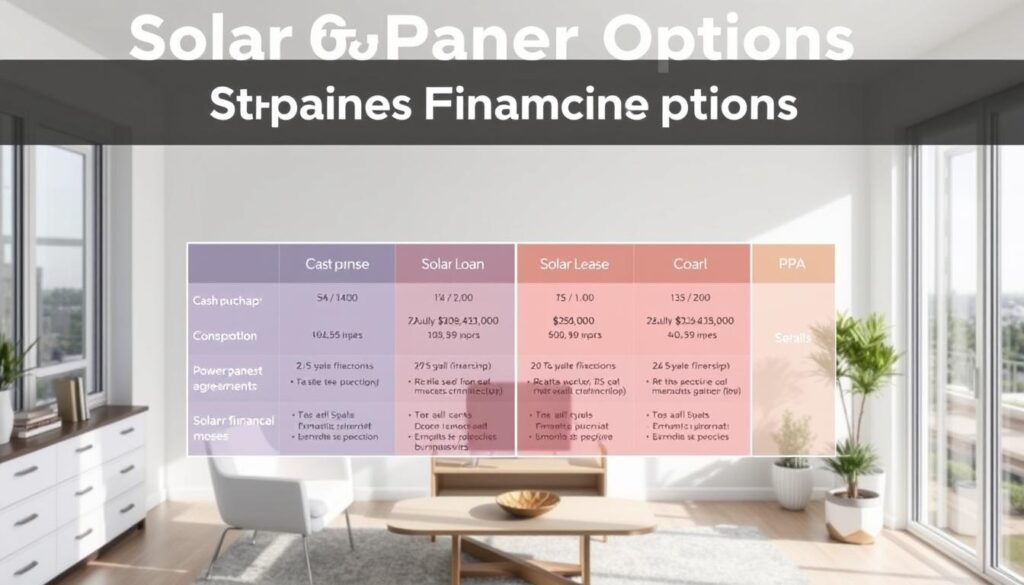
Best Solar Panel Financing Options for Homeowners
Choosing the right financing plan helps you achieve affordable solar panel installation without breaking your budget. Explore these options to find the best solar panel financing options for your goals.
- Cash Purchase: Pay upfront with savings up to 30% via the federal tax credit. A $30,000 system could cost $21,000 after credits. Though costly initially, this offers the highest long-term returns.
- Loans Options: Personal loans (6%–36% APR) or home equity lines let you spread payments. LightStream requires a 660+ credit score, while Best Egg starts at 600. Loans add interest but lower upfront costs.
- Leases/PPAs: Pay $100–$200/month with no down payment. While affordable short-term, these transfer tax credits to providers and limit equity gains.
| Option | Upfront Cost | Tax Credit | Monthly Cost | 20-Year Savings |
|---|---|---|---|---|
| Cash | $21,000 | Yes | $0 | $30k system saves $7,633 over 20 years |
| Loan | Loan covers costs | Yes | $200–$400/month | Less than cash due to interest |
| Lease | $0 | No | $100–$200/month | Matches utility costs but misses ownership benefits |

Loans like those from Upgrade (580 credit score) offer terms up to 25 years, but higher APRs slow savings. Leases lower upfront costs but tie you to contracts. Use federal tax credits wisely—they drop to 22% by 2034. Compare terms to align with your budget and long-term plans.
Maximizing Federal and State Tax Incentives
Lowering home solar cost starts with claiming available tax incentives. The federal solar investment tax credit (ITC) reduces expenses by 30% of system costs through 2032, dropping to 22% by 2034. For a $20,000 installation, that’s up to $6,000 in savings this year.

The Federal Solar Investment Tax Credit Explained
This credit offsets up to 30% of system costs, with credits rolling over annually if tax liability is lower. For example, a $21,816 system saves around $6,544. Check deadlines: credits drop to 26% in 2023 and 22% in 2024. All systems must have a PIN starting in 2025 for eligibility.
State-Specific Rebates and Incentives
States offer unique programs. Compare top incentives:
| State | Credit | Max |
|---|---|---|
| Hawaii | 35% | $5,000 |
| Idaho | 40% Year 1 | $5,000 |
| New York | 25% | $5,000 |
Visit the DSIRE database to explore options in your area.
Local Utility Company Programs
- Net metering credits offset bills when systems produce excess energy.
- Solar Renewable Energy Certificates (SRECs) can be sold for extra income.
- Some utilities offer upfront rebates for qualified systems.
Combine these with best solar panel financing options to stretch savings further. Always verify utility-specific rules when planning installations.
Calculate Your Solar Energy Cost Savings Over Time
Planning for solar energy’s long-term value starts with tools like the solar power system cost calculator or solar energy cost savings calculator. These free online tools reveal how your investment grows over decades, balancing upfront costs with energy independence.
Using a Solar Power System Cost Calculator
Start by inputting details like your home’s energy use and local utility rates. Reliable calculators like EnergySage’s tool factor in state incentives and federal tax credits. For example, a 6.9kW system in RI saves faster due to high $0.2174/kWh rates. The calculators also show:
- Yearly savings based on system efficiency
- Impact of tax credits reducing upfront costs
- Projected savings over 25+ years
Estimating Your Break-Even Point
Break-even happens when savings match initial costs. A $31,558 system in RI breaks even in 5.6 years due to high utility rates, while Louisiana’s lower rates extend payback to 13 years. Key variables include:
- State-specific incentives
- Local electricity rate trends
- System efficiency and maintenance costs
Long-Term Financial Benefits
Average savings reach $48,000 over 25 years, according to EnergySage. With electricity rates rising 6.2% annually:
Electricity prices rose an average of 6.2% from 2022 to 2023, according to the U.S. Energy Information Administration (EIA).
Systems in high-rate states like Hawaii ($0.3382/kWh) see returns 3-5 years faster than low-rate regions. Even with system degradation, panels retain 80%+ efficiency over 25 years, locking in savings as grid prices climb.
Hidden Costs and Considerations Before Installation
While solar energy offers long-term savings, hidden expenses can impact your budget. A solar panels cost estimator or solar power system cost calculator can help uncover these details early. For example, inverters often need replacing every 10–15 years, costing $1,000–$2,000. Annual maintenance might add $150–$350, while roof repairs before installation could run into thousands if your structure isn’t sturdy enough.
Insurance premiums may rise after installation, and utility fees like grid connection charges can linger even if you generate excess energy. Over time, panels degrade slightly, losing about 0.5–1% efficiency yearly. Disposal costs for old panels also matter, as recycling programs aren’t yet widespread.
| Cost Type | Estimated Cost | Frequency | Notes |
|---|---|---|---|
| Inverter Replacement | $1,000–$2,000 | Every 10–15 years | Check warranty terms |
| Maintenance | $150–$350/yr | Yearly | Cleaning and inspections |
| Rooftop Prep | $1,000–$5,000+ | One-time | Depends on roof condition |
| Insurance | +5–15% premium increase | Monthly | Verify policy coverage |
“A poorly maintained system can reduce energy output by 15% or more.”
Tools like a solar power system cost calculator can estimate soft costs like permitting delays (adding weeks or even months to project timelines). Supply chain issues may inflate costs by 10%, so compare quotes from multiple installers. Factor in dealer fees, which can climb to 40% of total costs when financing is involved.
Planning with a solar panels cost estimator ensures no surprises. Factor in these details to avoid gaps in your budget. Transparency now saves headaches later.
Conclusion: Is Solar Power Worth the Investment for Your Home?
Deciding whether to invest in solar panels depends on your unique situation. The average cost of solar panels for home installations ranges from $15,000 to $30,000 before incentives, but federal tax credits and state programs can lower this significantly. For example, the 30% Federal Investment Tax Credit reduces costs by thousands, and programs like California’s rebates add extra savings.
Over 25 years, homeowners often save $20,000–$30,000 on electricity bills while reducing carbon emissions by 100,000 pounds. Plus, homes with solar panels sell for about 4% more than those without—adding up to $12,300 for a $300,000 home. However, your break-even timeline, usually 7–10 years, depends on your location’s sunlight, utility rates, and local policies.
Use a solar energy cost savings calculator to estimate your monthly bill reductions and payback period. Consider if you’ll stay in your home long enough to recoup costs and check roof condition for durability. While upfront costs exist, long-term savings and environmental benefits make solar a smart choice for many. Start by comparing quotes from certified installers to see how your home stacks up.
