Home solar installation cost varies widely, but the average U.S. system for an 11 kW solar array now costs $20,552 after federal incentives. Before tax credits, the price starts at $29,360. This reflects a $15,000 drop over 20 years, making solar energy more accessible than ever. Federal tax credits cut costs by 30%, while state programs like those in California or Arizona can lower prices further. The average home saves $48,000 over 25 years by switching to solar, offsetting rising electricity rates that jumped 6.2% in 2023.
Key factors shaping home solar installation cost include system size, local incentives, and regional pricing. A 2,000-square-foot house typically needs 10 kW of solar panels costing around $13,075 post-credits. Batteriesies systems add up to $13,000 extra, but federal rebates reduce upfront expenses. Whether financed or paid in cash, understanding these numbers helps homeowners weigh long-term savings against initial investment.
Key Takeaways
- Average solar system cost after tax credits: $20,552 for 11 kW
- California residents pay as little as $14,476 after incentives
- Payback periods range from 3.7 to 19 years depending on location
- Federal tax credits save $6,544 on average installations
- Systems last 25+ years with 85% efficiency retention
Understanding Home Solar Installation Cost Basics
Shopping for solar panels? Let’s break down the numbers. The solar panel installation cost varies widely based on equipment, location, and system size. Start by knowing what’s included in the final price.
What Factors into Your Total Investment
Equipment and labor make up the bulk of expenses. Here’s the breakdown:
- Modules (10%): Panels themselves
- Mounting hardware (13%)
- Inverters (8%): Convert solar energy to usable power)
- Installation labor (7%)
- Permits and inspections (9%)
National Average Costs at a Glance
Average U.S. prices for a typical 11kW system: solar panel installation cost starts at $15,000 and tops out at $25,000 pre-incentives. After applying the 30% federal tax credit, most homeowners pay between $20,552 and $22,090. Smaller 5kW systems average $12,000, while larger 20kW setups hit $35,000+.
Cost per Watt Explained
Think of this like gas prices: solar panel price per watt measures cost efficiency. The national average is $2.56/W pre-tax credits. Larger systems often lower this rate—buying more panels spreads fixed costs like permits over more watts. For example, a 10kW system might cost $2.65/W while a 20kW system could drop to $2.45/W.
Solar Panel Types and Their Price Points
Choosing the right solar panel type shapes both your home solar panel cost and long-term energy output. Let’s break down the three main options:
- Monocrystalline: Top-tier efficiency (18-22%) comes with a premium price. Panels start at $0.30/watt, with brands like Qcells (420-440W) and REC Pure RX (460W) offering high performance. Their sleek design and 25+ year lifespan make them ideal for space-limited roofs.
- Polycrystalline: A cost-effective middle ground at $0.25/watt. These panels achieve 13-17% efficiency and work well for larger properties. Silfab’s 420W models deliver strong value for residential solar cost budgets.
- Thin-Film: Budget-friendly options under $0.20/watt, but require 30% more roof space. Their shorter 15-20 year lifespan makes them less common for homeowners.

“Efficiency gains reduce long-term costs,” notes NREL analysts. Monocrystalline systems save 15-20% in roof space compared to thin-film, balancing upfront investment with space efficiency. While thin-film panels cost 30-40% less initially, their lower durability may increase replacement expenses over 25 years.
Higher-efficiency panels like HK2 Black Series (22.2% efficiency) cost $0.35/watt but generate 25% more power over their lifetime. Shoppers comparing home solar panel cost should weigh upfront price against 25-year energy output. Next, we’ll explore how system size impacts total expenses.
Size Matters: How System Capacity Affects Your Bottom Line
| System Size (kW) | Cost per Watt ($/W) | Total Cost Before Incentives |
|---|---|---|
| 3 | $3.10 | $9,300 |
| 5 | $2.97 | $14,850 |
| 7 | $2.81 | $19,670 |
| 10 | $2.73 | $27,300 |
| 12 | $2.65 | $31,800 |
The table shows that a 10kW system costs $2.73 per watt—25% less than a 3kW system’s $3.10 per watt. This means bigger systems cut the cost of installing solar panels by spreading fixed and labor costs over more capacity.
“Scaling smartly ensures every dollar spent works harder for your wallet.”
Scaling tips:
- Calculate your home’s energy needs using 12 months of bills to avoid underestimating.
- Adding an electric vehicle? Size your system to cover future demand—expanding later costs 15-30% more.
- Larger systems qualify for better bulk pricing, lowering per-watt rates by up to 15%.
Larger systems also benefit from federal tax credits. For instance, a 10kW system’s $27,300 price drops to $20,448 after the 26% federal tax credit. Prioritize sizing for long-term goals to maximize savings without overspending upfront.
Regional Variations in Solar Power Installation Cost
Your ZIP code can change your solar power installation cost by thousands of dollars. From labor rates to sunlight patterns, here’s what shapes your investment.
Location drives prices through:
- Labor costs: Urban areas like Los Angeles charge more per hour than rural regions.
- Market competition: High-demand states like California have lower per-watt prices due to more installers.
- Weather needs: Hot climates may require sturdier panels, boosting costs.
California often leads in affordability, with per-watt rates from $2.50 to $3.45. A 10kW system there costs $25,000–$34,600 before tax breaks. Meanwhile, states like West Virginia and Alabama rank highest due to smaller local markets and limited competition. Sunnier states like Arizona may need larger systems but benefit from lower per-watt pricing.
Permit fees and inspection rules add 3–5% to your home solar installation cost. States policies matter:
- Streamlined permitting in states like CA reduce delays and fees.
- Areas with strict regulations (e.g., outdated zoning laws) increase “soft costs.”
Delays from red tape can raise total expenses by up to 15% in some regions.
Federal Tax Incentives and State Rebates
Maximizing savings starts with understanding federal and state incentives. The solar energy installation cost can drop significantly when combining credits like the federal Investment Tax Credit (ITC). For example, a average cost of solar panels system priced at $18,000 with a $1,000 utility rebate qualifies for a 26% federal credit ($4,680).)
Current federal rules allow a 30% ITC for solar PV systems installed through 2032, dropping to 26% in 2023 and 22% in 2024. This credit applies to qualified expenses like panels, inverters, and installation labor. Unlike deductions, tax credits reduce your tax bill dollar for dollar.
| Incentive | Type | Percentage | Cap |
|---|---|---|---|
| Federal ITC | Tax Credit | 30% (2022-2032) | No cap |
| New York State | State Credit | 25% | $5,000 max |
| Utility Rebates | Local Programs | Varies by provider | Check local programs |
State programs like New York’s 25% credit (up to $5,000) stack with federal incentives. A $18,000 system in New York could save up to $8,190 through combined credits (26% federal + 25% state). Homeowners must file IRS Form 5695 to claim the ITC. Remember credits are nonrefundable—if the credit exceeds your tax liability, the excess rolls over to the next year.
Eligible equipment includes solar panels, heat pumps, and battery storage (minimum 3 kWh capacity. Starting 2025, all equipment must carry a four-digit Qualified Manufacturer (QM) code. Avoid double-dipping: rebates reduce eligible expenses but don’t eliminate your right to the full tax credit percentage.
Financing Your Residential Solar Cost: Options and Considerations

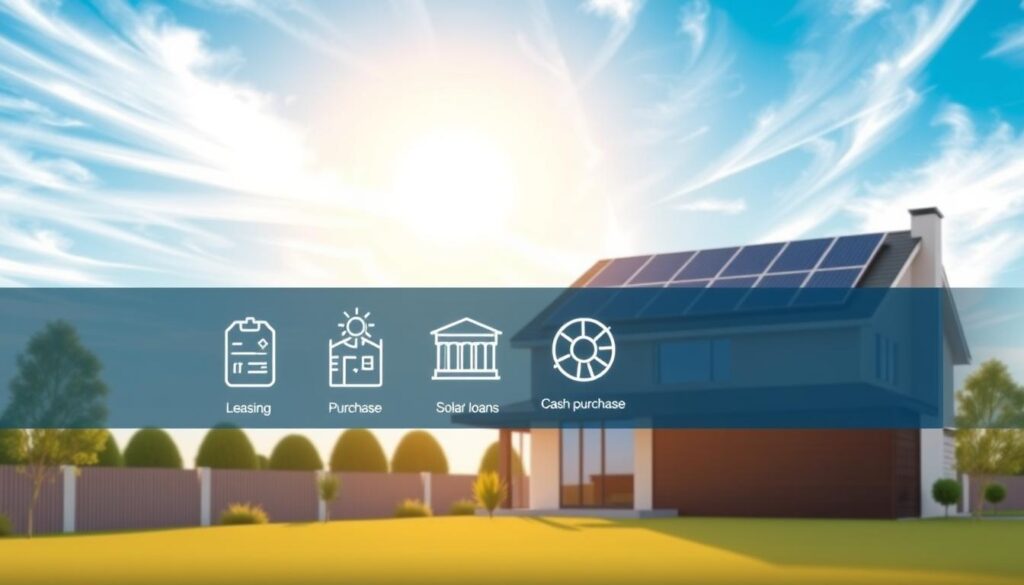
Managing the cost of installing solar panels starts with exploring financing choices that fit your budget. Whether you prefer upfront payments or monthly plans, each option balances initial expense and long-term savings.
Cash Purchase vs. Solar Loans
Cash purchases eliminate interest but require paying the full residential solar cost upfront. Solar loans offer flexibility: secured loans use your home as collateral for lower rates (6–36%), while unsecured loans avoid this risk but charge higher interest. FHA Title I loans let borrowers with lower credit scores qualify for competitive terms. Temporary 0% loans can bridge costs until tax credits apply.
- Secured loans: 5–20 year terms, lower interest
- Unsecured loans: No collateral but higher rates
- FHA loans: Credit scores as low as 500 accepted
Solar Leases and Power Purchase Agreements (PPAs)
Leases let you pay a fixed monthly fee without owning panels. PPAs require payments based on energy produced. Both options skip upfront costs but may include yearly rate increases clauses (2–5%). Contracts often span 20–25 years, with PPA rates tied to system output.
Comparing Long-Term Financial Benefits
Over 25 years, cash buyers save the most but face large initial outlays. Loans add interest but allow gradual repayment. Leases/PPAs reduce upfront needs but limit long-term savings. For example, a $20,552 system (after tax credits) financed via a 15-year loan at 8% APR adds roughly $170/month but avoids upfront cash.
Choosing between these paths depends on your cash flow and savings goals. Explore loans, leases, or PPAs to align your residential solar cost with your financial plan.
Hidden Costs and Additional Expenses to Consider

Planning for solar energy requires more than just the upfront solar system installation cost. Hidden expenses like roof work, permits, and long-term upkeep can affect your budget. Here’s what to watch for beyond the quoted price.
Rooftop Readiness and Upgrades
Roof issues often add’t show up until inspections start. Structural repairs or reinforcements to support panel weight can add $1,000 to $3,000 to the solar panel installation cost. Steep roofs or unique materials may require custom labor fees. Avoid future headaches by addressing roof leaks or aging shingles before installation.
- Roof inspections cost $150–$300 to identify weaknesses
- Replacements for cracked panels under warranty may require out-of-pocket labor fees
Permitting and Regulatory Fees
Local governments charge fees for permits, interconnection agreements, and safety inspections. These vary widely:
- Building permits: $200–$500
- Utility interconnection fees: $100–$500
- Final inspections: $100–$300
“Soft costs like permits account for 65% of total installation expenses.” – National Renewable Energy Laboratory
Maintenance and Long-Term Upkeep
Annual cleaning ($150–$350) keeps panels running efficiently. After 10–15 years, string inverters need replacement at $1,000–$2,000. Check warranty terms: most panels keep 80% efficiency by year 25, but repairs for non-warranty issues (like storm damage) aren’t always covered.
Some insurers raise premiums post-installation. Battery storage adds $700–$1,500 per kWh, though prices drop yearly. Monitor all these costs to ensure your investment stays on track.
Return on Investment: When Will Your Solar Energy Installation Cost Pay Off?
Solar energy installation cost varies, but most homeowners see returns within 6 to 10 years. Let’s break down how your home solar panel cost translates into savings. Factors like location, incentives, and electricity rates shape this timeline.
- Location: High-electricity states like Hawaii or California cut payback to 4–6 years.
- Incentives: The 30% federal tax credit slashes upfront costs.
- System size: Larger systems offset more bills but take longer to recoup costs.
Consider this example: A $29,360 system with tax credits and rebates drops to $18,552. Annual savings from reduced bills ($2,100) plus incentives ($513) total $2,613 yearly. Dividing $18,552 by $2,613 gives a 7.1-year payback. Over 25 years, this system could net $33,545 in savings.
Long-term gains matter too. Solar panels last 25+ years, outperforming stock market averages. States like Massachusetts see 14% annual returns, outpacing typical investments. Even in regions with slower payback, rising utility rates shrink that timeline over time.
Conclusion: Is Solar Worth the Investment for Your Home?
Choosing home solar panel cost depends on your energy use and location. The average solar power installation cost in the U.S. ranges from $15,000 to $30,000 before tax credits. Federal rebates like the 30% Investment Tax Credit reduce upfront expenses, making solar more accessible. Over 25 years, most households save $25,000–$45,000 due to lower electricity bills and rising utility rates. A 5kW system might cost $12,500–$25,000 after incentives, paying for itself in 4–5 years through energy savings.
Shaded roofs or low energy use may reduce benefits. But for sunny areas with high electricity rates, savings grow. Solar systems last 25+ years, cutting CO2 emissions by 100,000 pounds. Plus, homes with solar sell 4.1% faster and add up to $12,300 to a $300,000 home’s value. While maintenance is minimal, check local net metering policies and warranties before deciding.
Start by comparing quotes from licensed installers. Factor in state rebates and long-term savings. Solar’s upfront costs turn into decades of energy independence and environmental impact. Weigh these factors to see if solar aligns with your financial and sustainability goals.
